


 +86 152 6060 5085
 English
 русский
 español
 português
 العربية
 Polski
- Home
- Products
- News
- Blog
- About Us
- Contact Us

Blog
Catalog
1.What is Delta E?

Delta E is a calculation method used to measure the difference between the displayed color and the input color. A lower Delta E value indicates higher accuracy, while a higher Delta E value indicates a significant mismatch.
It is a standard metric established by the Commission Internationale de l'Éclairage (CIE).
The letter "E" in Delta E stands for "Empfindung", which means "sensation" in German. Delta is a Greek term that represents the incremental change of a variable. Overall, the term Delta E refers to the difference in sensation.
Delta E has a measurement range of 0 to 100, where 0 means minimal color difference and 100 means complete color distortion. The standard range of perceptual differentiation is as follows:
≤ 1.0: Imperceptible to the human eye
1–2: Perceptible upon close observation
2–10: Obvious at a glance
11–49: Color similarity exceeds contrast
100: Completely opposite colors
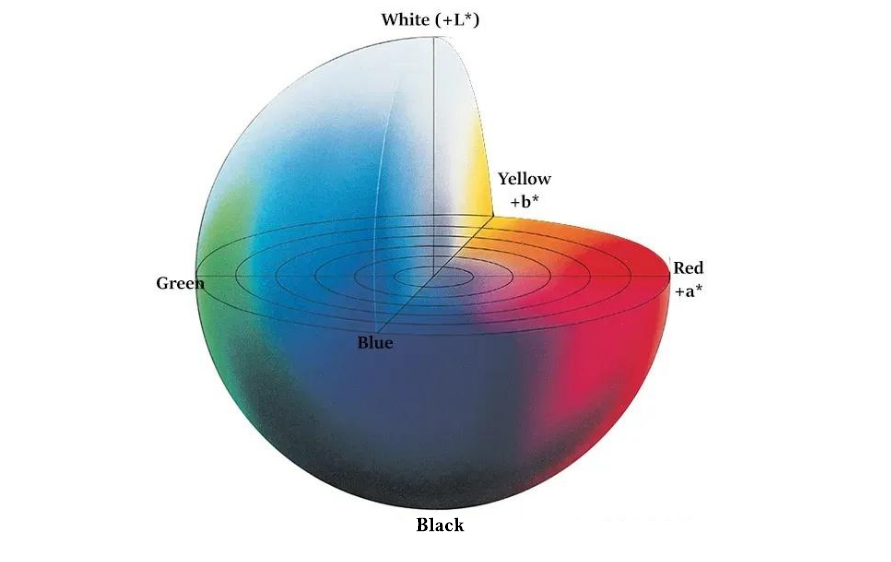
2. What Do Lab* Color Values Represent?
Colors measured in the CIE Lab color space are defined by three coordinates – L*, a*, and b* – with each coordinate corresponding to the following attributes:
L* – Lightness
a* – Degree of redness or greenness
b* – Degree of yellowness or blueness
Thus, Delta E (total color difference) is calculated based on delta L*, delta a*, and delta b* color values. All these values together provide a complete numerical description of a color within a rectangular coordinate system. Their specific meanings are as follows:
delta L*: Lightness difference between the sample and the standard color
delta a*: Redness or greenness difference between the sample and the standard color
delta b*: Yellowness or blueness difference between the sample and the standard color
3. How to Calculate Delta E?
In the context described in Section 2 above, the higher the value, the greater the difference in that specific dimension. Since Delta E is derived from three core components, its calculation is easier than you might think.
You simply need to calculate the square of the difference between the corresponding L*, a* and b* values, sum these squared differences together, and finally take the square root of this total sum.

This formula clearly quantifies the difference between two colors.
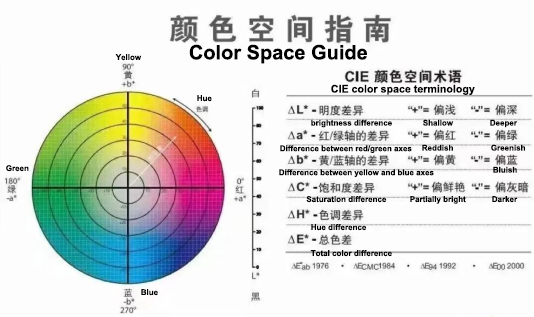
Then how can we determine whether the data measured by the instrument deviates from the target color in terms of lightness or darkness, redness or yellowness?
For a more intuitive understanding, you can refer to the diagram below.
Email: hello@utstesters.com
Direct: + 86 152 6060 5085
Tel: +86-596-7686689
Web: www.utstesters.com

Room 312, Block D, Jiayuan Garden, No.2 Zhongfa Road, Zhangzhou City, Fujian Province, China

+86 152 6060 5085

+86 596 7686689


 hello@utstesters.com
 hello@utstesters.com
 +86 152 6060 5085
 +8615260605085